
Introducing the graph
The graph/table/pie chart/bar chart/diagram …
- gives information about/on …
- provides information about/on …
- shows …
- illustrates …
- compares …
- explains why …
- describes …
- draws the conclusion of (a survey) …
Example: The pie charts provide information on the proportion of males and females working in agricultural sector.
 |  |  |
|---|---|---|
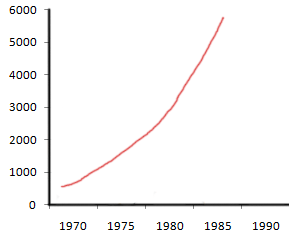
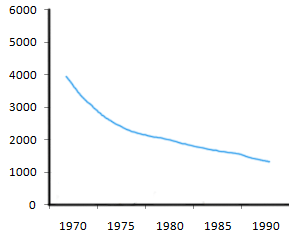
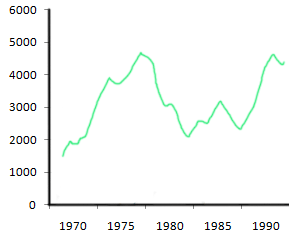
a rise (of) an increase (of) a growth (of) a peak (of) a surge (of) Example: a rise of prices | a fall (in) a decrease (in) a decline (in) a dip (in) Example: a fall in prices | a fluctuation (of) a variation (in) Example: a fluctuation of prices |
to rise to increase to surge to grow to peak Large rises: to rocket to soar to leap (->leapt) | to fall to decrease to decline to dip to dive to plunge Large falls: to plummet | to fluctuate to vary |
Description of changes
|  | Useful phrases |
|---|---|---|
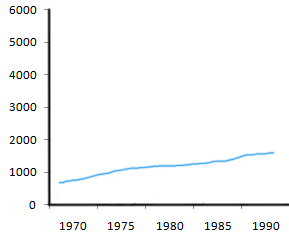
Adverb sharply suddenly rapidly abruptly dramatically significantly considerably markedly wildly | Adverb slightly gently gradually steadily modestly marginally Example: the prices increased modestly
| a small fraction, a small number, a small minority a large portion, a significant majority nearly a fifth, almost 10%, in region of 40%, more than a half, over a quarter, around two thirds, more or less three quarters, exactly one in ten, approximately a third |
sharp sudden rapid abrupt dramatic steep significant considerable marked substantial spectacular Example: there was a considerable growth | slight gentle gradual steady consistent modest marginal Example: there was a gradual decline | Row 2 col 3 content |