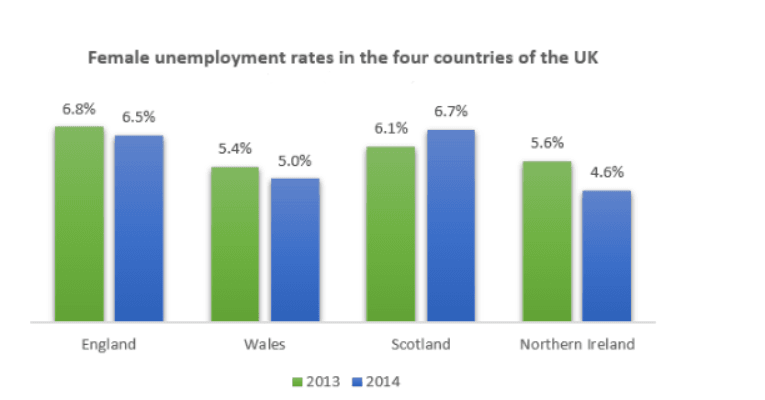
The graph below shows female unemployment rates in each country of the United Kingdom in 2013 and 2014.
Summarise the information by selecting and reporting the main features, and make comparisons where relevant.
Write at least 150 words.
Model Answer
The bar charts show the unemployment level in UK countries in 2013-2014 years. From the charts, it is recognized that all countries experienced slight decreases except Scotland.
The percentage of unemployed women declined by only 0.3 % , from 6.8 to 6.5 in England. Although the figures are different from England in Wales, however, this country also achieved tiny amount of a fall in terms of unemployment, just 0.4 %. The percentage of unemployed females show a decline in Northern Ireland too; however, here a result is better in comparison to the other two countries since unemployment rates decreased by 1 % , from 5. to 4.6 %. The only country which witnessed an increase in terms of unemployed women is Scotland. The percentage which was 6.1 % in 2013, rose noticeably and reached to 6.7 % in 2014.
Generally,the trends are downwards in 3 countries maybe due to sufficient and right policies. Only Scotland, the number of females who cannot find a job surged.